August Overview
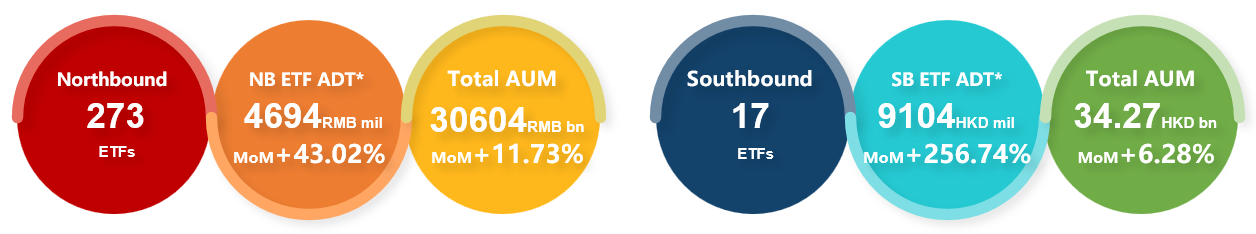
Source: SSE, SZSE, HKEX, CESC. Data cut-off date: 31 Aug 2025.
*SouthBound/Northbound ETF ADT: ADT under Stock Connect.
Top 10 Northbound ETFs of Aug
| TOP 10 ETFs by AUM |
| Rank |
Code |
Name |
AUM
(RMB mil) |
| 1 |
510300 |
Huatai-PB CSI 300 ETF |
419,682.20 |
| 2 |
510310 |
E Fund CSI 300 ETF Initiating Fund |
299,383.82 |
| 3 |
510330 |
ChinaAMC CSI 300 ETF |
220,876.50 |
| 4 |
159919 |
Harvest SZSE SME-CHINEXT 300 ETF |
193,359.10 |
| 5 |
510050 |
ChinaAMC China 50 ETF |
182,732.56 |
| 6 |
510500 |
China Southern CSI 500 ETF |
133,141.90 |
| 7 |
159915 |
E Fund Chinext ETF |
102,193.04 |
| 8 |
588000 |
ChinaAMC China Science And Technology Innovation Board 50 Component ETF |
81,945.75 |
| 9 |
512100 |
China Southern CSI 1000 ETF |
75,637.14 |
| 10 |
588080 |
E Fund China Science And Technology Innovation Board 50 Component ETF |
75,548.39 |
- Huatai-PB: In July, the CSI 300 Index rose by 3.54%, with overall growth remaining modest. In recent months, market sensitivity to geopolitical issues and U.S. stock performance has continued to decline, with A-shares increasingly focusing on domestic factors. Investors are now focusing more on the performance and expectations of listed companies, returning to a more conventional rhythm. We are optimistic about the medium-term outlook for A-shares. However, we anticipate a relatively flat upward trajectory, which makes it unlikely that there will be a sharp rally. In terms of allocation value, the CSI 300 Index continues to demonstrate superior performance in comparison to small- and mid-cap indices. (12/08/2025)
-
Harvest Fund: The official manufacturing PMI for June 2025, although still below the boom bust line, slightly rose to 49.7%, mainly due to the continued contribution of the "export rush" during the US China tariff window period, as well as the gradual improvement of domestic demand under the effect of supportive policies in the early stage, which also reflects strong economic resilience. Considering the gradual implementation of stable growth policies and the recovery of consumer confidence, it will contribute to a sustained and moderate macroeconomic recovery. Looking ahead, although exports may gradually face pressure due to the impact of tariffs, the policy of expanding domestic demand is expected to have a negative impact on the economy caused by the decline in exports. The macro economy is expected to continue to recover, and market sentiment and investor risk appetite are expected to remain. As the core asset of the A-share market, the CSI 300 Index is expected to fully benefit, with significant allocation value. (03/07/2025)
| TOP10 ETFs by Monthly Return |
| Rank |
Code |
Name |
Return
(1Month) |
| 1 |
515880 |
Guotai CSI All Share Communication Equipment ETF |
45.89% |
| 2 |
515980 |
Harfor CSI Artificial Industry ETF |
45.67% |
| 3 |
515050 |
ChinaAMC CSI 5G Communication Theme ETF |
38.29% |
| 4 |
159994 |
Yinhua CSI 5G Communication Theme ETF |
38.07% |
| 5 |
159819 |
E Fund Artificial Intelligence ETF |
36.74% |
| 6 |
512930 |
Ping An CSI Artificial Intelligence ETF |
36.37% |
| 7 |
515070 |
ChinaAMC CSI Artificial Intelligence ETF |
36.25% |
| 8 |
588200 |
Harvest SSE STAR Chip Index ETF |
35.72% |
| 9 |
588290 |
Huaan SSE STAR Chip Index ETF |
35.21% |
| 10 |
159780 |
China Southern CSI Scientific Innovation And Entrepreneurship 50 ETF |
34.20% |
- Guotai Fund: Looking ahead, the AI trend remains unequivocal. In North America, rapidly growing cloud revenues are already recycling back into compute infrastructure investments, forming a virtuous cycle. Domestically, major cloud providers are demonstrating similar momentum. Overall, AI development is poised to accelerate. Since the volume production of NVIDIA's GB200 this year, cloud providers have gained enhanced compute resources while software development velocity has increased. Against the backdrop of sustained global investments in compute infrastructure, the optical module market is expected to maintain strong growth momentum. (08/09/2025)
- China AMC: 中长期看AI应用仍处于极早期,作为算力集群拓展的基础组件,光模块及电路板仍然具备高增长能力,叠加相关公司技术迭代,存在量价齐升机会,这是板块长期逻辑,决定市场长期的表现。而短期看光模块的需求持续高增,AI电路板存在供需缺口,整体高景气度有望持续凝聚资金共识,适合以跟踪景气度为主的右侧投资方式,投资者需紧盯海外算力资本开支及投资者对海外算力预期的变化。风险视角看近期二级市场持续演绎乐观预期,已经积累不少涨幅,出现拐点需要适当性防御,且注意美股科技股业绩情况。(03/09/2025)
| TOP 10 ETFs by Monthly Net-Buy |
| Rank |
Code |
Name |
Net Buy**
(RMB mil) |
| 1 |
512880 |
Guotai CSI All Share Investment Banking & Brokerage Index ETF |
8,841.52 |
| 2 |
159870 |
Penghua CSI Subdivision Chemical Industry Theme ETF |
8,614.08 |
| 3 |
515880 |
Guotai CSI All Share Communication Equipment ETF |
4,414.31 |
| 4 |
512000 |
Hwabao WP CSI All Share Investment Banking & Brokerage Index ETF |
3,817.32 |
| 5 |
159928 |
China Universal CSI Consumer Staples ETF |
3,757.13 |
| 6 |
515220 |
Guotai CSI Coal ETF |
2,916.65 |
| 7 |
510050 |
ChinaAMC China 50 ETF |
2,606.16 |
| 8 |
516150 |
Harvest CSI Rare Earth Industry ETF |
2,574.55 |
| 9 |
512690 |
Penghua CSI Alcoholic Drink Index ETF |
2,478.08 |
| 10 |
159819 |
E Fund Artificial Intelligence ETF |
2,275.05 |
- Guotai Fund: From a supply perspective, the current 'anti-overcapacity' initiative primarily addresses structural supply-demand imbalances, with China's coal industry policy now shifting from scale expansion to quality-driven transition. Domestic coal production capacity is increasingly constrained by dual-carbon policies and stricter safety regulations, making new capacity additions more susceptible to policy adjustments. As anti-overcapacity measures gain traction, coal prices continue their upward trend. On the demand side, coal maintains relative demand inelasticity as a foundational energy source. With the supply-demand balance tightening marginally and policy catalysts accelerating, coal price recovery expectations are strengthening. Should economic fundamentals improve subsequently, resource-side demand would receive direct support. (08/09/2025)
-
Harvest Fund: Firstly, in terms of location, the current rare earth industry index has a TTM P/E ratio of around 32x, which is in the historical lower 35% percentile and is in a typical undervalued range. At the same time, the current level of the rare earth industry index has fallen by about 31% compared to the high point in September 2021, which is also a relatively low point. Therefore, the current position of rare earths is not high. From a long-term investment perspective, rare earths are important metals in the era of "all things electric drive" and have strong long-term investment value. Rare earth is an industry with constantly changing downstream demand. The main function of rare earth is to make rare earth permanent magnets, which are mainly used in various motors. From a first principles perspective, rare earth permanent magnets are metals that convert electrical energy and kinetic energy. In the future, under the background of dual carbon, electricity will be our main energy source. Starting from new energy vehicles, various electric energy application tools will have countless layers, and rare earths as such energy metals will continue to highlight their value. Finally, the direct reason for this round of upward trend is the reassessment of the strategic value of rare earths as a strategic resource in China under the trade conflict between China and the United States. In the past, the A-share market mainly reflected the cyclical growth attribute of rare earths, and did not demonstrate the value of strategic resource commodities. In this trade conflict, rare earths have been repeatedly mentioned as an important bargaining chip in the negotiations between China and the United States, which is more important and conducive to improving the long-term valuation of rare earths. (03/07/2025)
| TOP 10 ETFs by Monthly ADT |
| Rank |
Code |
Name |
ADT***
(RMB mil) |
| 1 |
588000 |
ChinaAMC China Science And Technology Innovation Board 50 Component ETF |
6,119.62 |
| 2 |
159915 |
E Fund Chinext ETF |
4,374.85 |
| 3 |
510300 |
Huatai-PB CSI 300 ETF |
3,932.54 |
| 4 |
512880 |
Guotai CSI All Share Investment Banking & Brokerage Index ETF |
3,458.95 |
| 5 |
588200 |
Harvest SSE STAR Chip Index ETF |
3,386.93 |
| 6 |
510050 |
ChinaAMC China 50 ETF |
2,519.65 |
| 7 |
510500 |
China Southern CSI 500 ETF |
2,103.04 |
| 8 |
512480 |
CPIC CSI All Share Semiconductors & Semiconductor Equipment ETF |
2,049.10 |
| 9 |
159949 |
Huaan SZSE Chinext 50 ETF |
1,882.97 |
| 10 |
588080 |
E Fund China Science And Technology Innovation Board 50 Component ETF |
1,712.05 |
- Guotai Fund: Listed securities firms reported 'better-than-expected' first-half performance, with both revenue and net profit attributable to parents achieving robust growth, significantly boosting market confidence. Since the beginning of the year, the equity market has demonstrated a steady upward trajectory, accompanied by notably improved trading activity. Key indicators including turnover, margin trading balances, and equity product issuance have consistently recovered, collectively driving the securities sector into a valuation restoration phase and fueling earnings growth. With their strong beta characteristics, securities firms’ core business performance remains closely tied to capital market dynamics. As global liquidity narratives converge, capital markets exhibit vigorous trading activity and rising risk appetite, synchronously lifting the securities industry’s sentiment. (08/09/2025)
Southbound Eligible ETFs Overview
| Code |
Name |
Tracking Index |
AUM
(HKD mil) |
1M Return |
Net Buy**
(HKD mil, 1M) |
ADT***
(HKD mil, 1M) |
| 2800 |
TRACKER FUND OF HONG KONG |
Hang Seng Index |
156,648.75 |
1.32% |
-4,984.51 |
17,819.71 |
| 2828 |
HANG SENG CHINA ENTERPRISES INDEX ETF |
Hang Seng China Enterprises Index |
36,278.73 |
0.68% |
5,190.07 |
9,380.24 |
| 3033 |
CSOP HANG SENG TECH INDEX ETF |
Hang Seng TECH Index |
62,558.07 |
4.01% |
10,746.15 |
7,775.15 |
| 3067 |
ISHARES HANG SENG TECH ETF |
Hang Seng TECH Index |
25,688.21 |
4.07% |
3,301.65 |
291.60 |
| 3037 |
CSOP HSI ETF |
Hang Seng Index |
1,096.62 |
1.33% |
25.89 |
4.16 |
| 3032 |
HSTECH ETF |
Hang Seng TECH Index |
6,146.49 |
4.02% |
490.19 |
167.12 |
| 2837 |
GX HS TECH |
Hang Seng TECH Index |
1,521.44 |
4.04% |
0.00 |
2.46 |
| 3088 |
CAM HS TECH |
Hang Seng TECH Index |
1,729.32 |
4.03% |
-7.14 |
18.95 |
| 3110 |
GX HS HIGH DIV |
Hang Seng High Dividend Yield Index |
3,842.19 |
0.76% |
105.79 |
17.80 |
| 3403 |
CAM HSI ESG |
HSI ESG Enhanced Index |
10,142.16 |
2.93% |
687.90 |
57.74 |
| 2801 |
ISHARES CHINA |
MSCI CHINA |
24,162.61 |
4.19% |
0.00 |
8.32 |
| 2825 |
WISECSIHK100ETF |
CSI HK 100 |
2,494.28 |
2.33% |
9.96 |
0.02 |
| 3040 |
GX MSCI CHINA |
MSCI CHINA |
1,723.21 |
4.11% |
261.86 |
0.55 |
| 3069 |
CAM HSBIOTECH |
Hang Seng Hong Kong-Listed Biotech |
1,287.49 |
1.18% |
271.08 |
71.36 |
| 3070 |
PING AN HKDIV |
CSI HK Dividend |
4,553.41 |
-0.83% |
-708.47 |
18.30 |
| 3115 |
ISHARESHSI |
Hang Seng Index |
2,154.00 |
1.33% |
9.42 |
4.39 |
| 3039 |
EFUNDHSIESG |
HSI ESG Enhanced Index |
654.99 |
2.94% |
0.00 |
1.13 |
Source: SSE, SZSE, HKEX, CESC. Data cut-off date: 31 Aug 2025.
**Net-Buy(estimated)= Σ(Fund units Increment × Daily Turnover / Daily Volume)
***ADT: ADT in home market
DATABASE
More Info of ETFs' Issuers
Guotai Fund is one of the first fund management company established in China. As of July 22, 2022, there were 41 non-currency ETFs in Guotai Fund, with a total scale of 98.478 billion yuan.
Huaan Funds Management Company was founded in 1998. At the end of 2021, the total AUM of Huaan is nearly 600 Billion CNY.
China Asset Management Company (ChinaAMC) was founded in 1998. By the end of 2021 it managed 58 ETF with a combined asset under management of RMB 245.7 billion.
China Southern Asset Management Co., Ltd. was founded on March 6. As of June 30 2022, SAM managed 296 mutual funds worth RMB 1050.2 billion.
Penghua Fund was established in 1998, As of June 30, 2022, the company has managed 267 public funds with a total scale of 929.2 billion. A total of 22 ETFs were managed, with a total scale of 24.2 billion.
Harvest Fund was established in March, 1999. As of June 2022, the company has managed 275 public funds with a total scale of 781.623 billion. A total of 32 ETFs were managed, with a total scale of 36.258 billion.
Fullgoal Fund Management Co Ltd was founded in 1999. As of 30 June, 2022, Fullgoal Fund has a total mutual fund AUM CNY 647 billion (excluding MMF and short-term wealth management bond funds).
Yinhua Fund was established in May 2001. By the end of 2023, there are 40 ETFs under management, with a total AUM over RMB 130 billion.
China Merchants Fund Management Co., Ltd. was established in 2002. As of December 31, 2022, the non-monetary fund assets under management of China Merchants Fund was more than 560 billion yuan, ranking No.5 in the industry at first time.
Hwabao WP Fund Management Co., Ltd. established on March 7, 2003. As of Dec 31th, 2023, the company's assets under management reached over 320 billion yuan, with 138 open-end funds under management.
GF Fund Management Co., Ltd. established on August 5, 2003. As of Dec 31th, 2021, the company's assets under management reached over a trillion, with 295 open-end funds under management.
Tianhong Asset Management was established in 2004. As of June 30, 2022, 160 public funds had been managed,which the scale of public fund management is up to 1196.90 billion yuan.
Huatai-PineBridge Fund Management Co., Ltd (“Huatai-PineBridge” or “HTPB”) was Established in 2004. HTPB’s ETFs have combined assets under management of over US $16 billion (as of 31 Dec 2021).
China Universal Asset Management Co., Ltd. ("CUAM") was established in 2005 and is headquartered in Shanghai. As of the end of the second quarter of 2022, CUAM has managed 252 mutual funds in China.
IMPORTANT NOTICE
IMPORTANT RISK WARNINGS / NOTES Information provided on this webpage of Stock Connect ETF Information Portal (the “Webpage”) is for general information and reference only. None of the information contained on the Webpage constitutes nor is intended to be construed as an advertisement or investment advice or an offer, solicitation, or recommendation to deal in any securities or investments in any jurisdiction and does not purport to represent or warrant the outcome of any investment strategy, program or product.
The Webpage is not directed at, and is not intended for distribution to or use by, any person or entity in any jurisdiction or country where such distribution or use would be contrary to law or regulation or which would subject China Exchanges Services Company Limited (“CESC”), Hong Kong Exchanges and Clearing Limited, Shanghai Stock Exchange and Shenzhen Stock Exchange (together, the “Entities”, each an “Entity”) to any registration requirement within such jurisdiction or country. No content in the Webpage may be regarded as creating any obligation on the part of any of the Entities.
CESC does not provide investment, legal, tax or other advice through any information and nothing herein should be construed as being investment, legal, tax or other advice. CESC does not represent that any investment instruments or services discussed are suitable for any investor.
Investors should note that all investments involve risks including the possibility of loss of the capital invested. Prices of investment products may go up as well as down and may even become valueless, and past performance information presented is not indicative of future performance. Investors should not base on the information to make any investment decision, but should read in detail the offering documents and terms and conditions (including the full text of the risk factors stated therein) of the relevant investment products, and should seek the advice of a professional financial advisor when making a decision about investments.
DISCLAIMERAll information contained in this website and any pages (the “Website”) thereof (the “Information”) is provided for reference only. The information is provided by China Exchanges Services Company Limited (“CESC”) for general information and reference only. CESC endeavours to ensure the accuracy and reliability of the Information but makes no warranty or representation as to its accuracy, completeness, reliability or suitability for any particular purpose. CESC accepts no liability (whether in tort or contract or otherwise) whatsoever to any person for any loss or damage arising from any inaccuracy or omission in the Information and/or from any decision, action or non-action based or in reliance upon the Information. None of the Information is intended to constitute investment advice and/or a recommendation to make (or refrain from making) any kind of investment decision. Any person intending to use the Information and/or any part thereof should seek independent professional advice. The Information is provided without warranties of any kind, either expressed or implied, including (but not limited to) warranties of merchantability, merchantable quality, title, fitness for a particular purpose, security and non-infringement.
Hong Kong Exchanges and Clearing Limited, Shanghai Stock Exchange and Shenzhen Stock Exchange do not guarantee the accuracy and reliability of the Information and accepts no liability (whether in tort or in contract or otherwise) for any loss or damage suffered by any person arising from any inaccuracies or omissions and/or for any reliance placed on such Information.
CESC neither endorses nor is responsible for the accuracy or reliability of the information produced and provided by third-party information providers on this webpage of ETF Connect Information Portal (the “Webpage”), and under no circumstances will CESC be liable for any loss or damage caused by any opinion or statement made in the Webpage. The information is for general information and reference only and does not constitute nor is it intended to be construed as any professional advice, offer, solicitation or recommendation to deal in any of the securities or investments mentioned herein. Any projections and opinions expressed herein are expressed solely as general market commentary and do not constitute solicitation, recommendation, investment advice, or guaranteed return. The opinions expressed are those of the featured speaker(s), and do not represent CESC's views. The opinions given by the featured speaker(s) are subject to changes without notice and should not be construed as a solicitation, recommendation, or advice on any individual holdings or market sectors. No guarantee, representation, warranty or undertaking, express or implied, is made as to the fairness, accuracy, timeliness, completeness or correctness of any third party information, projections and/or opinions provided on the Webpage and the basis upon which any such third party projections and/or opinions have been made, and no liability or responsibility is accepted by CESC in relation to the use of on any such third party information, projections and/or opinions whatsoever provided on the Webpage. Investors must make their own assessment of the relevance, accuracy and adequacy of the information, projections and/or opinions provided on the Webpage and make such independent research/investigations as they may consider necessary or appropriate for the purpose of such assessment. CESC does not make any representation, solicitation, recommendation, or assessment as to whether or not any of the information mentioned herein is/are suitable or applicable to any persons and thus shall not be held responsible in this regard. Investors should make investment decision(s) based on his/her own financial situation, investment experience, investment objectives, and specific needs; and if necessary, should seek independent professional advice before making any investment decision(s).
LINKED WEBSITESThe Webpage may contain links to other websites which are not operated by CESC. These links have been provided solely for you to obtain further information about other relevant entities in the market. CESC have no control over the information referred to on these sites or the products or services on them, and therefore makes no representations and accepts no responsibility regarding the accuracy or suitability of the information, services or products described on them. You are advised to make your own enquiries in relation to third parties described or linked on this internet site. Inclusion of a link to a third party site should not be construed as an endorsement of such third party site by CESC or that party's endorsement of the Website.
By linking to sites not operated by CESC, CESC is not authorizing the reproduction of any material on such sites, as such material may be the subject of third party intellectual property rights.
DOWNLOADS AND E-MAILThe Webpage allows for downloading of files. CESC does not accept liability for any loss or damage which may result from the downloading or e-mailing of any of these files. E-mail is not secure and can be intercepted, corrupted or amended. CESC does not accept liability for errors or omissions arising as a result of interrupted or defective transmission.
COPYRIGHT NOTICEOn the premise of complying with relevant laws and this statement, any institution or individual may browse and download the content of the Website for non-commercial purposes, but distribution, redistribution, reproduction, modification, transmission, use, reuse and/or storage of the Information in whole or in part, in any form or by any means are strictly prohibited without the prior written permission of CESC.